How Acquisition Offers Are Actually Priced
Strategic buyers, financial buyers and acquihires value the same company completely differently. Here is what each is paying for, and how the number is built.
Founders tend to imagine acquisition price as a judgement on the company. It is not. It is the output of a specific buyer's model, and three different buyers looking at identical financials will produce three very different numbers because they are buying three different things.
The three buyer types
Strategic buyers are operating companies. They are buying capability, market share, a team, or the removal of a competitor. They can pay above any standalone valuation because the asset is worth more inside their business than outside it.
Financial buyers — private equity — are buying cash flows. They model a return over five to seven years, usually with debt, and their price is capped by what that model tolerates.
Acquihires are buying people. The price is roughly a recruiting cost, and the product is usually shut down.
| Buyer | Values | Typical basis | Price ceiling set by | | --- | --- | --- | --- | | Strategic | Capability, share, speed | Revenue multiple, sometimes strategic premium | What building it themselves would cost | | Financial | Predictable cash flow | EBITDA multiple | Return model and debt capacity | | Acquihire | Engineers | $0.5M-$2M per engineer | Comparable recruiting cost |
How a strategic buyer builds the number
A strategic buyer asks one question: what is this worth to us? The model runs:
- Standalone value. What the company is worth on its own numbers.
- Plus revenue synergies. Your product sold into their customer base.
- Plus cost synergies. Duplicate functions removed — finance, legal, overlapping sales.
- Minus integration cost and risk. Migration, attrition, delay.
Worked example. Your company: $8M ARR, growing 60%, 78% gross margin.
| Component | Value | | --- | --- | | Standalone at 6x ARR | $48,000,000 | | Revenue synergy (their 40,000 customers, modest attach) | $22,000,000 | | Cost synergy (removed overhead, capitalised) | $9,000,000 | | Integration cost and risk discount | -$14,000,000 | | Buyer's internal ceiling | $65,000,000 | | Likely opening offer | $40,000,000-$48,000,000 |
The gap between opening offer and internal ceiling is the negotiation, and the only thing that reliably moves you up it is the credible existence of another buyer or a genuine willingness not to sell.
What multiple you can expect
Revenue multiples move constantly with the market, but the relative drivers are stable.
| Factor | Pushes the multiple up | Pushes it down | | --- | --- | --- | | Growth rate | Above 50% year over year | Under 20% | | Net revenue retention | Above 115% | Under 95% | | Gross margin | Above 75% | Under 55% | | Revenue concentration | No customer above 10% | One customer above 25% | | Rule of 40 | Growth + margin above 40 | Well below 40 | | Founder dependency | Team runs without founders | Everything routes through you |
Revenue concentration is the one founders underestimate. A single customer at 35% of revenue can cut the multiple substantially, because the buyer is pricing the risk that the customer leaves after the deal.
The build-versus-buy test
Before any strategic conversation, answer it from their side: what would it cost them to build this themselves, in money and in months? If the answer is eighteen months and $10M of engineering, your price is anchored near that — unless you have something they cannot build, such as data, a distribution position, regulatory approval, or a genuinely hard-to-hire team. That is where premiums come from.
What the headline number is not
The announced price is a gross figure. What founders actually receive depends on:
- Liquidation preferences. Preferred stock is paid first. With $30M raised at 1x preference and a $45M sale, the preference stack takes $30M before common holders see anything.
- Deal structure. Cash, buyer stock, earn-out and escrow are very different assets.
- Escrow holdback. Typically 10-15% held for 12-24 months against warranty claims.
- Transaction costs. Bankers, legal and accounting can be 2-6% of deal value.
- Tax. Depends on the structure and your holding period.
A $45M headline can easily become $9M distributed to common shareholders at closing. This is the single most common surprise in founder exits.
Common mistakes
- Taking the first call as a process. One buyer with no alternatives is a price-taker's position.
- Sharing detailed financials before an indication of value. Get a range in writing first.
- Optimising for the headline number. All-cash at $40M frequently beats $55M loaded with earn-out and buyer stock.
- Letting diligence stall the business. Missing your numbers mid-process is the most common cause of a re-trade.
- Ignoring the preference stack. Model your personal proceeds at three different prices before you negotiate anything.
How the simulator models it
Garage to IPO offers acquisition paths with terms that respond to your traction, growth and market conditions, sitting alongside the IPO route. Comparing the two on the same run makes the trade-off concrete: a certain payout now against a larger, riskier public-market outcome later.
Preparing the company to be bought
Buyers pay more for companies that are easy to buy. Most of this work takes months, which is why it should start long before you want to sell.
- Clean corporate records. Cap table, board consents, stock option grants, IP assignments and customer contracts, all findable in an afternoon. Diligence problems here delay deals, and delayed deals get re-priced.
- Contract assignability. Check whether your major customer agreements survive a change of control. A contract requiring customer consent to transfer hands that customer leverage during your deal.
- Reduce founder dependency. If every significant relationship, decision and piece of system knowledge routes through a founder, the buyer is buying a person and will price retention accordingly.
- Fix revenue concentration early. It takes a year or more to dilute a customer that represents a third of revenue, and it is one of the largest single discounts applied to a multiple.
- Keep clean, consistent monthly numbers. Two years of unchanged definitions is worth real money in diligence speed.
- Know your buyer universe. Maintain a list of ten to fifteen plausible acquirers and build relationships with them years before you need to. Inbound interest from someone who already knows you is worth more than any banker introduction.
Where to go next
Before signing anything, read earn-outs, escrow and the real payout and what IPO day actually looks like for the alternative path.
Common questions
- Why do strategic buyers pay more than financial buyers?
- They can add revenue and cost synergies to your standalone value, so the company is worth more inside their business than it is on its own numbers.
- What hurts an acquisition multiple most?
- Slow growth, weak net revenue retention, low gross margin and revenue concentration. A single customer above a quarter of revenue is priced as a serious risk.
- Is the announced acquisition price what founders receive?
- No. Liquidation preferences, escrow holdbacks, earn-outs, transaction fees and tax all sit between the headline number and the amount distributed to common shareholders.
Keep reading
Life After the Sale: Lock-Ups, Earn-In Years, and What Founders Do Next
The integration year, the money decisions that cannot be undone, and why the identity problem hits harder than the financial one.
Earn-Outs, Escrow, and Why the Headline Number Is Not What You Get
A worked walk from a $60M announcement down to what actually lands in a founder bank account, and which terms to fight for.
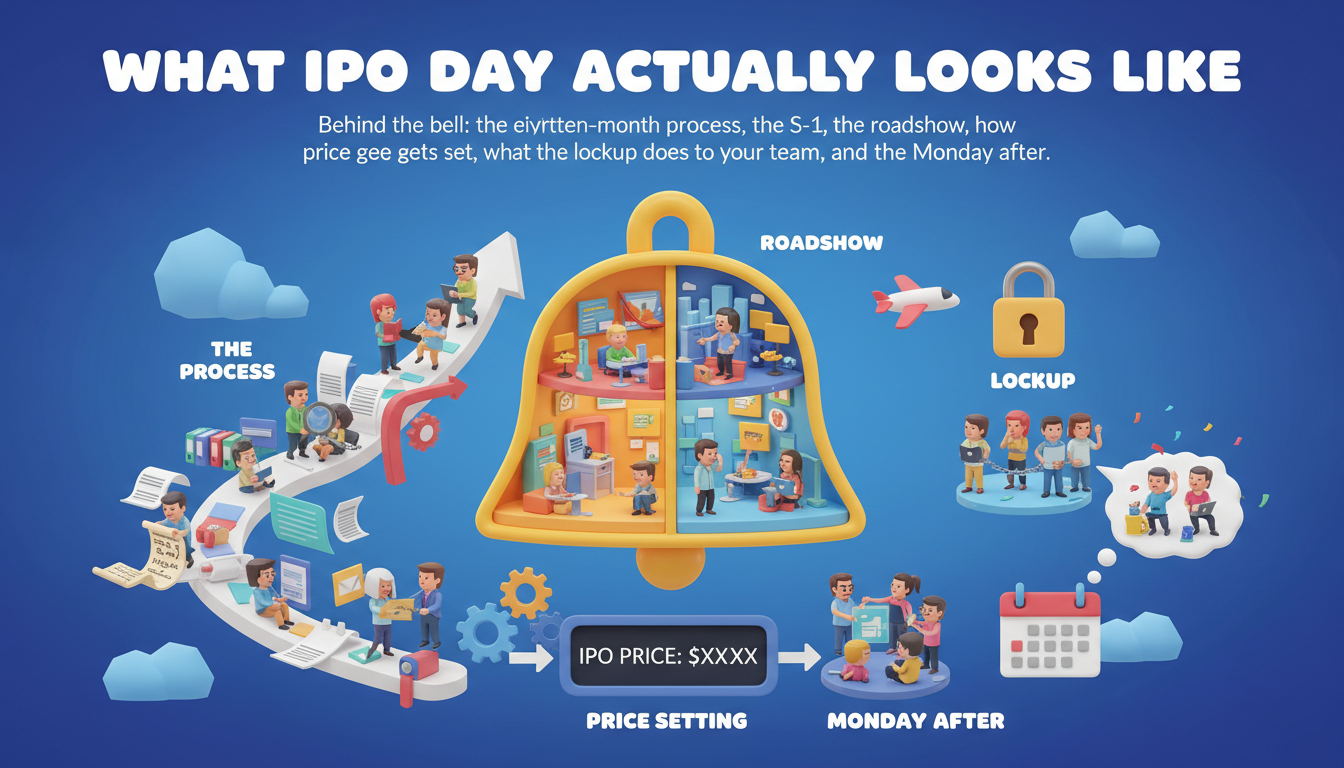
What IPO Day Actually Looks Like
Behind the bell: the eighteen-month process, the S-1, the roadshow, how the price gets set, what the lockup does to your team, and the Monday after.